My blog primarily covers small business financial planning issues but occasionally wanders into technical issues when it seems like the advice would be useful and the information is not plainly available elsewhere.
In this case many of us work from home or mobile locations using a Windows 10 based notebook computer. Wireless signal strength is an important factor in productivity and reliability of continued connection. Most of us know how to use the signal strength bars to estimate signal strength. But what about what you want more specific data, and not just bars? How can you see real data in numerical form that is more specific than an icon with a number of bars?
Follow these simple three steps:
- Type “command” in your search bar in the bottom left of your screen next to the start button. (If you have hidden your search bar see this Windows 10 help page to show it).

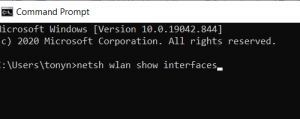
2. type “netsh wlan show interfaces”

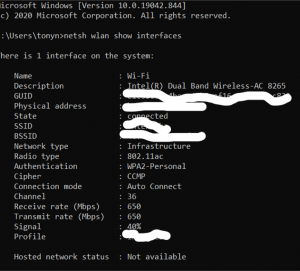
3. Look at the line near the bottom that says “signal” and lists a percentage. Anything at 80% or above is said to be good. In this case, the example shows 40%.I find that this is workable but not ideal. I also find that if I repeat the test several times it gives a range of results that is more useful than a signal measurement and may indicate the variability as well as the momentary signal strength. In my case, the signal strength in the weakest area of my house varied from 40% to 62%.

